code • information design • art direction
The users of Stack Overflow
Stack Overflow is a privately held website, the flagship site of the Stack Exchange Network, created in 2008 by Jeff Atwood and Joel Spolsky. It was created to be a more open alternative to the earlier question and answer sites such as Experts-Exchange. Since 2011, they ask their visitors to take a survey, from topics such as technical expertise, professional expectations, and social delimiters. I have decided to cross some of these results and explore some of them regarding race and inequality, zeroing on education and salary analysis. The data is from the 2017 survey.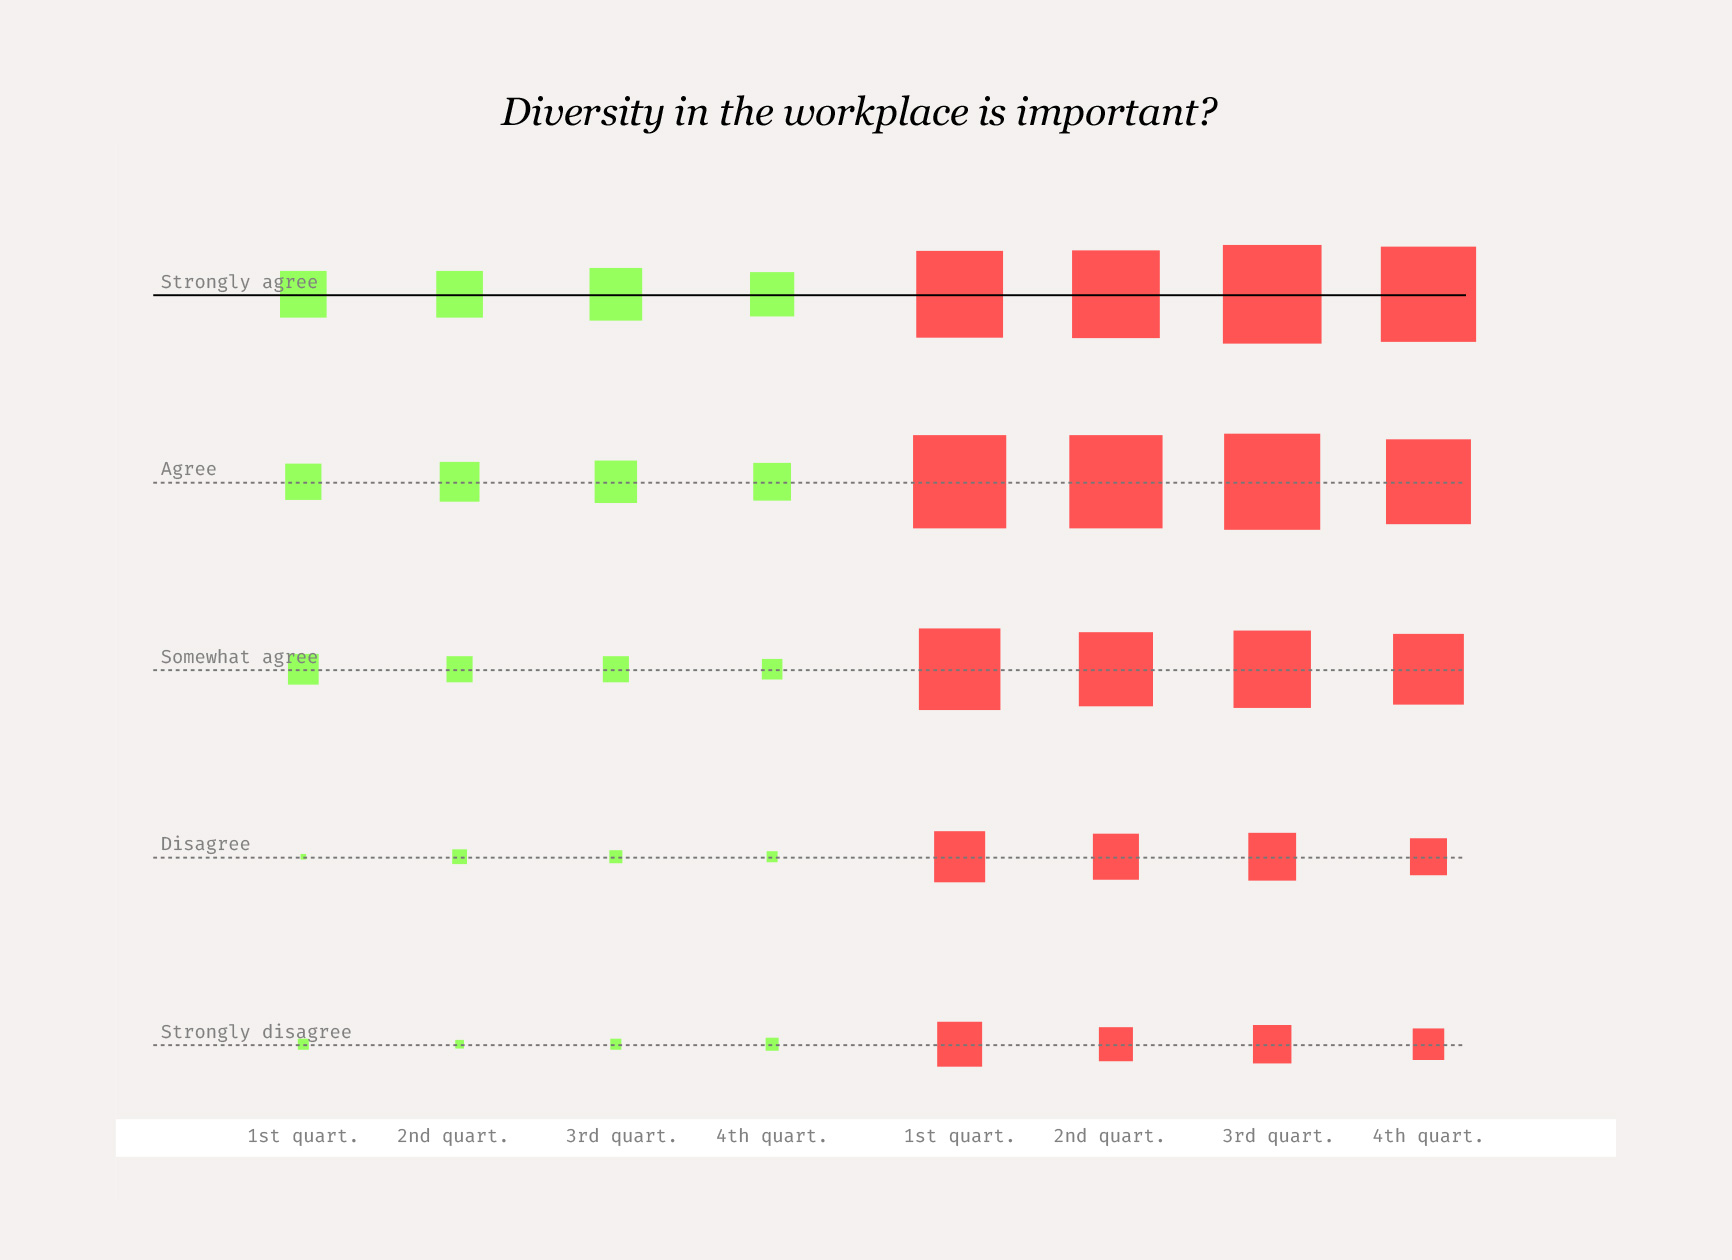


How this work was done
The data was parsed and then aggregated into two categories. Each row show a square for a specific answer from the survey; its area is related to the number of answers. The x-axis shows the answers by quartiles of yearly income, in US$ dollars.
The visualization was rendered with D3. Assignment for Info Aesthetics - Parsons 2017.